
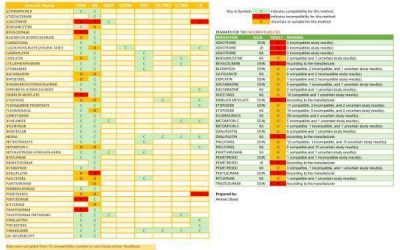
Chemotherapy Compatibility Chart Update
February 1, 2019TUMOR FDG-PET/CT IMAGING
March 17, 2019About Abiraterone Acetate:
It’s an antiandrogen medication that is used to treat prostate cancer.
Abiraterone Acetate is used for:
Prostate cancer, metastatic:
- Treatment of metastatic, castration-resistant prostate cancer
- Treatment of metastatic, high-risk castration-sensitive prostate cancer

Abiraterone Acetate Mechanism of Action:
Abiraterone selectively and irreversibly inhibits CYP17 , an enzyme required for androgen biosynthesis which is expressed in testicular, adrenal, and prostatic tumor tissues. Inhibits the formation of the testosterone precursors dehydroepiandrosterone (DHEA) and androstenedione.
Dosing of Abiraterone Acetate:
Adults:Zytiga: 1,000 mg once daily (in combination with prednisone 5 mg twice daily)
Yonsa (micronized formulation): 500 mg once daily (in combination with methylprednisolone 4 mg twice daily)
Doesn’t require dose adjustment for renal patients.
Patients with currently hepatic impairment; it depends on the severity of the liver status:Mild: No dosage adjustment necessary.Moderate : 250 mg once daily (Zytiga) or 125 mg once daily (Yonsa). Permanently discontinue if ALT and/or AST >5 times the ULN or total bilirubin >3 times ULN occur during treatment in patients with baseline moderate hepatic impairment.Severe: Do not use.
Ref.BNFLexicomp – Drug information handbook